GOOGL / G19 / 2026-10-12
Google G19:滞后MSFT状态驱动的独立PE估值Google G19: independent P/E valuation with lagged MSFT stateGoogle G19:滯後MSFT狀態驅動的獨立PE估值
当前G19候选估值,未采用Current G19 candidate values, not adopted當前G19候選估值,未採用
研究日期2026-10-12;Google财务、利率和价格评价仍使用2026-10-06冻结截面,最新Google财务季度2026Q2。MSFT状态来自前一完整月末2026-09-30,不能称10月12日最新行情重算。Research date: October 12, 2026. Google financial inputs, rates and price evaluation remain frozen at October 6, 2026, with latest Google financial quarter 2026Q2. The MSFT state is from the preceding complete month-end, September 30, 2026; these are not October 12 live-market calculations.研究日期2026-10-12;Google財務、利率和價格評價仍使用2026-10-06凍結截面,最新Google財務季度2026Q2。MSFT狀態來自前一完整月末2026-09-30,不能稱10月12日最新行情重算。
| 期限与用途Horizon and role期限與用途 | G19候选估值G19 candidate valueG19候選估值 | 冻结Core EPSFrozen Core EPS凍結Core EPS | 同一条件PEShared conditional P/E同一條件PE | 估值日期 / 截止日Valuation date / deadline估值日期 / 截止日 |
|---|---|---|---|---|
| 0M · 条件公平估计Conditional fair estimate條件公平估計 | $321.28 | 12.9502 | 24.8090× | 2026-10-06 |
| 6M · 期限估值Horizon valuation期限估值 | $340.47 | 13.7238 | 24.8090× | 2027-04-06 |
| 12M · 期限估值Horizon valuation期限估值 | $377.67 | 15.2232 | 24.8090× | 2027-10-06 |
G19只增加PE解释状态,Google三期限Core EPS完全不变;0M、6M、12M共享同一条件PE。这是独立条件估值,不使用该起点Google当日股价定价;但历史Google股价仍是训练标签,上月MSFT股价仍是已声明的同行状态输入。它不是完全脱离市场价格的DCF内在价值,也不是训练出的未来最高价分位目标。G19 adds only a P/E explanatory state. Google Core EPS paths are unchanged, with one conditional P/E shared across 0M, 6M and 12M. Google’s own origin-day price is excluded from that origin’s prediction, but historical Google prices remain training labels and the prior MSFT month-end price is a declared peer-state input. This is not market-price-free DCF intrinsic value or a trained future-peak quantile target.G19只增加PE解釋狀態,Google三期限Core EPS完全不變;0M、6M、12M共享同一條件PE。這是獨立條件估值,不使用該起點Google當日股價定價;但歷史Google股價仍是訓練標籤,上月MSFT股價仍是已聲明的同行狀態輸入。它不是完全脱離市場價格的DCF內在價值,也不是訓練出的未來最高價分位目標。
G19的18项冻结条件中,11项通过、7项失败,未替换主预测。个股页继续分别保留G16的0M条件公平估计$318.51与G05的6M $368.45、12M $464.42;三个报价标注各自版本,不组合成新模型。11 of 18 frozen conditions pass and 7 fail. G19 does not replace the retained forecasts. The equity page retains separate G16 conditional 0M value $318.51 and G05 6M / 12M forecasts $368.45 / $464.42, each labeled with its own version rather than combined into a new model.G19的18項凍結條件中,11項通過、7項失敗,未替換主預測。個股頁繼續分別保留G16的0M條件公平估計$318.51與G05的6M $368.45、12M $464.42;三個報價標註各自版本,不組合成新模型。
新增同行状态怎样进入独立PEHow the additional peer state enters independent P/E新增同行狀態怎樣進入獨立PE
固定MSFT为唯一同行,统一采用每个Google起点所在日历月之前一个完整月的最后常规交易日。历史训练月末、财报后季度起点和当前起点使用完全相同的滞后规则。不是用MSFT的绝对高倍数直接赋给Google,而是检验其相对训练历史的倍数状态,在成长、国债利率和财报兑现差之外是否还有剩余解释力。MSFT is the sole fixed peer. For every Google origin, use the last regular session of the calendar month immediately preceding that origin’s month. Historical month-end training, quarterly earnings origins and the current origin use the same lag rule. The model does not assign MSFT’s absolute multiple to Google. It tests whether the peer’s valuation state relative to training history adds information beyond growth, Treasury yield and profit realization.固定MSFT為唯一同行,統一採用每個Google起點所在日曆月之前一個完整月的最後常規交易日。歷史訓練月末、財報後季度起點和當前起點使用完全相同的滯後規則。不是用MSFT的絕對高倍數直接賦給Google,而是檢驗其相對訓練歷史的倍數狀態,在成長、國債利率和財報兑現差之外是否還有剩餘解釋力。
peerDay(o) = last_regular_session_of_previous_complete_calendar_month(o)
m_i = log(MSFT_close(peerDay(i)) / MSFT_HL4_CoreEPS_0(peerDay(i))) / 0.10
s_q = log(actual_OP_q / prior_exact_postearnings_F4_forecast_OP_q) / 0.10
y_i = log(GOOGL_historical_spot_i / unchanged_GOOGL_CoreEPS_0_i)
x_i = [growth_i/0.10, nominal10Y_percent_i/1.0, s_q_i, m_i]
mu = each origin’s original selected-pool weighted feature means
minimize sum_i[w_i × (y_i − a − b·(x_i − mu))²] + 4 × (bg² + br² + bs² + bm²)
bg >= 0; br <= 0; bs >= 0; bm >= 0; intercept a free
PE = exp(a + b·(x_current − mu))
Value_h = unchanged_GOOGL_CoreEPS_h × PE, h in {0, 6, 12}权重、训练月及冷启动完全继承G18:最近60个原有效且已完成的历史月末,按Google财务季度平衡,730.5天半衰期,权重不再归一化。全部斜率ridge为4;低于12个月或4个不同财务季度时保留原历史中位数冷启动。新增系数为零是合法结果,不据此修改约束或再挑参数。Weights, training months and cold start are inherited from G18: the latest sixty originally valid completed historical month-ends, balanced by Google financial vintage with a 730.5-day half-life and no additional normalization. Ridge is four for every slope. The original historical-median cold start remains when fewer than twelve labels or four distinct financial vintages are present. A zero new slope is a valid outcome, not a reason to alter constraints or search parameters.權重、訓練月及冷啓動完全繼承G18:最近60個原有效且已完成的歷史月末,按Google財務季度平衡,730.5天半衰期,權重不再歸一化。全部斜率ridge為4;低於12個月或4個不同財務季度時保留原歷史中位數冷啓動。新增係數為零是合法結果,不據此修改約束或再挑參數。
| 当前拟合项Current fit item當前擬合項 | 数值 / 状态Value / status數值 / 狀態 |
|---|---|
| 训练月数 / Google财务季Training months / Google financial vintages訓練月數 / Google財務季 | 60 / 20 |
| 成长系数 bgGrowth slope bg成長係數 bg | 0.04716093 |
| 名义10Y系数 brNominal 10Y slope br名義10Y係數 br | -0.00000000 |
| 财报兑现差系数 bsProfit-realization slope bs財報兑現差係數 bs | 0.04266245 |
| 滞后同行系数 bmLagged-peer slope bm滯後同行係數 bm | 0.00000000 |
| 最后合法Google训练月末Latest eligible Google training month-end最後合法Google訓練月末 | 2026-09-30 |
G19只增加PE解释状态,Google三期限Core EPS完全不变;0M、6M、12M共享同一条件PE。这是独立条件估值,不使用该起点Google当日股价定价;但历史Google股价仍是训练标签,上月MSFT股价仍是已声明的同行状态输入。它不是完全脱离市场价格的DCF内在价值,也不是训练出的未来最高价分位目标。G19 adds only a P/E explanatory state. Google Core EPS paths are unchanged, with one conditional P/E shared across 0M, 6M and 12M. Google’s own origin-day price is excluded from that origin’s prediction, but historical Google prices remain training labels and the prior MSFT month-end price is a declared peer-state input. This is not market-price-free DCF intrinsic value or a trained future-peak quantile target.G19只增加PE解釋狀態,Google三期限Core EPS完全不變;0M、6M、12M共享同一條件PE。這是獨立條件估值,不使用該起點Google當日股價定價;但歷史Google股價仍是訓練標籤,上月MSFT股價仍是已聲明的同行狀態輸入。它不是完全脱離市場價格的DCF內在價值,也不是訓練出的未來最高價分位目標。
当前MSFT状态与Google PE核算Current MSFT state and Google P/E calculation當前MSFT狀態與Google PE核算
| 同行核算项Peer calculation item同行核算項 | 冻结值Frozen value凍結值 |
|---|---|
| MSFT完整月末日期MSFT completed month-end dateMSFT完整月末日期 | 2026-09-30 |
| MSFT常规收盘MSFT regular-session closeMSFT常規收盤 | $512.90 |
| MSFT同日起点NTM Core EPSMSFT own-date NTM Core EPSMSFT同日起點NTM Core EPS | 21.30900754 |
| MSFT经营PE=收盘÷Core EPSMSFT operating P/E = close / Core EPSMSFT經營PE=收盤÷Core EPS | 24.06963341× |
| MSFT盈利窗口MSFT earnings windowMSFT盈利窗口 | 2026-09-30 → 2027-09-30 (末日不含)(end exclusive)(末日不含) |
| 最新财政季度 / 发布日Latest fiscal quarter / release date最新財政季度 / 發佈日 | FY2026Q4 / 2026-07-29 |
| 直接季度稀释股数 / 税率代理Direct quarterly diluted shares / tax proxy直接季度稀釋股數 / 税率代理 | 7.443 十亿股billion shares十億股 / 15.00% |
| 同行当前标准化特征 / 原池中心Current scaled peer feature / selected-pool center同行當前標準化特徵 / 原池中心 | 31.80951022 / 32.64450272 |
| Google G18 PE → G19 PEGoogle G18 P/E → G19 P/EGoogle G18 PE → G19 PE | 24.80904148× → 24.80904148× |
| 当前新增同行logPE贡献Current additional peer log-P/E term當前新增同行logPE貢獻 | -0.00000000 |
| 重拟合后的Google PE净变化Net Google P/E change after refit重擬合後的Google PE淨變化 | 0.00% |
MSFT Core EPS采用同口径经营模型:以该同行月末当时已公开资料预测NTM税后营业利润,税率代理15%、F4收入路径、12季完整季节性、最新直接单季加权稀释股数。不是TTM GAAP EPS或分析师共识EPS。当前Google同比例估值未被MSFT的24.07倍强制替代:当前同行系数为零,Google仍为24.81倍。MSFT Core EPS uses the same operating model: forecast NTM after-tax operating profit from information public at the peer date, a 15% tax proxy, F4 revenue path, complete twelve-quarter seasonality and the latest directly reported single-quarter weighted diluted shares. It is neither TTM GAAP EPS nor analyst consensus EPS. Google’s multiple is not forcibly replaced by MSFT’s 24.07x: the current peer slope is zero and Google remains at 24.81x.MSFT Core EPS採用同口徑經營模型:以該同行月末當時已公開資料預測NTM税後營業利潤,税率代理15%、F4收入路徑、12季完整季節性、最新直接單季加權稀釋股數。不是TTM GAAP EPS或分析師共識EPS。當前Google同比例估值未被MSFT的24.07倍強制替代:當前同行係數為零,Google仍為24.81倍。
公司结构差异由Google自己的历史标签、截距及特征中心处理。将全部训练和当前同行PE统一乘2,21个季度/当前起点的Google估值均保持不变;把同行系数固定为零则复原G18。这是机制核验,不是两个新增可择优候选,亦不证明市场因果关系。Google’s own historical labels, intercept and feature centers handle a constant peer-level difference. Multiplying every training and current peer P/E by two leaves all twenty quarterly forecasts and the current forecast unchanged; fixing the peer slope at zero reproduces G18. These are mechanism checks, not additional selectable candidates or proof of market causality.公司結構差異由Google自己的歷史標籤、截距及特徵中心處理。將全部訓練和當前同行PE統一乘2,21個季度/當前起點的Google估值均保持不變;把同行係數固定為零則復原G18。這是機制核驗,不是兩個新增可擇優候選,亦不證明市場因果關係。
Microsoft原始季度财报来源Original Microsoft quarterly releaseMicrosoft原始季度財報來源 · Alphabet原始季度财报来源Original Alphabet quarterly releaseAlphabet原始季度財報來源
来源覆盖与预测时点边界Source coverage and forecast timing boundaries來源覆蓋與預測時點邊界
69个必要同行月末覆盖87个不同Google训练/评价/当前起点;原68个有效训练月、20个季度起点与当前全部保留。40份Microsoft原始季度发布已逐表核验,69个指定常规收盘均有准确日期来源。最早必要同行日2021-01-29,当前同行日2026-09-30;每个同行日起点至少12季完整历史。Sixty-nine required peer month-ends cover eighty-seven distinct Google training, evaluation and current origins. All sixty-eight original valid training months, twenty quarterly origins and the current origin are retained. Forty original Microsoft quarterly releases are checked against their income tables, and all sixty-nine specified regular-session closes have exact-date sources. Required peer dates run from January 29, 2021 to September 30, 2026, with at least twelve full historical quarters at each peer origin.69個必要同行月末覆蓋87個不同Google訓練/評價/當前起點;原68個有效訓練月、20個季度起點與當前全部保留。40份Microsoft原始季度發佈已逐表核驗,69個指定常規收盤均有準確日期來源。最早必要同行日2021-01-29,當前同行日2026-09-30;每個同行日起點至少12季完整歷史。
同行财务的原发布日必须严格早于其自己的月末价格日;同日发布保守排除,不使用后来对比栏重述、估算Q4股数、年度平均股数、GAAP/共识EPS替换或相邻月补值。Google原11个缺EPS/股数的月份继续不可估计,不删缺同行月份后从更早月份补满60。缺任一必要特征会停止估计,零同行系数和冷启动也不能豁免。Every peer financial release date must be strictly before the peer’s own month-end price date. Same-day releases are conservatively excluded. There are no later comparative restatements, estimated Q4 shares, annual average-share substitutes, GAAP/consensus EPS substitutions or adjacent-month filling. The eleven original Google months lacking EPS/shares remain not estimable. Missing peer rows cannot be dropped and backfilled to sixty, and a zero peer slope or cold start does not waive required coverage.同行財務的原發布日必須嚴格早於其自己的月末價格日;同日發佈保守排除,不使用後來對比欄重述、估算Q4股數、年度平均股數、GAAP/共識EPS替換或相鄰月補值。Google原11個缺EPS/股數的月份繼續不可估計,不刪缺同行月份後從更早月份補滿60。缺任一必要特徵會停止估計,零同行係數和冷啓動也不能豁免。
历史财务和预测在2026年按原始披露重建,不是当年的实际发布预测或认证vendor PIT。经营NOPAT/股模型不单独调整非经营资产、净现金/债务及公司会计差异;Microsoft与Google业务结构不同。本轮只能评价单一同行状态的增量相关,不能宣称完整可比公司估值。Historical financial states and forecasts are reconstructed in 2026 from original disclosures, not forecasts actually published at the time or certified vendor PIT. The operating-NOPAT-per-share model does not separately reconcile non-operating assets, net cash/debt or issuer accounting differences. Microsoft and Google have different business mixes. This study tests incremental association from a single peer state, not a complete comparable-company valuation.歷史財務和預測在2026年按原始披露重建,不是當年的實際發佈預測或認證vendor PIT。經營NOPAT/股模型不單獨調整非經營資產、淨現金/債務及公司會計差異;Microsoft與Google業務結構不同。本輪只能評價單一同行狀態的增量相關,不能宣稱完整可比公司估值。
五年财报后季度回测:触达与最高价差Five-year post-earnings quarterly test: hits and gaps to window highs五年財報後季度回測:觸達與最高價差
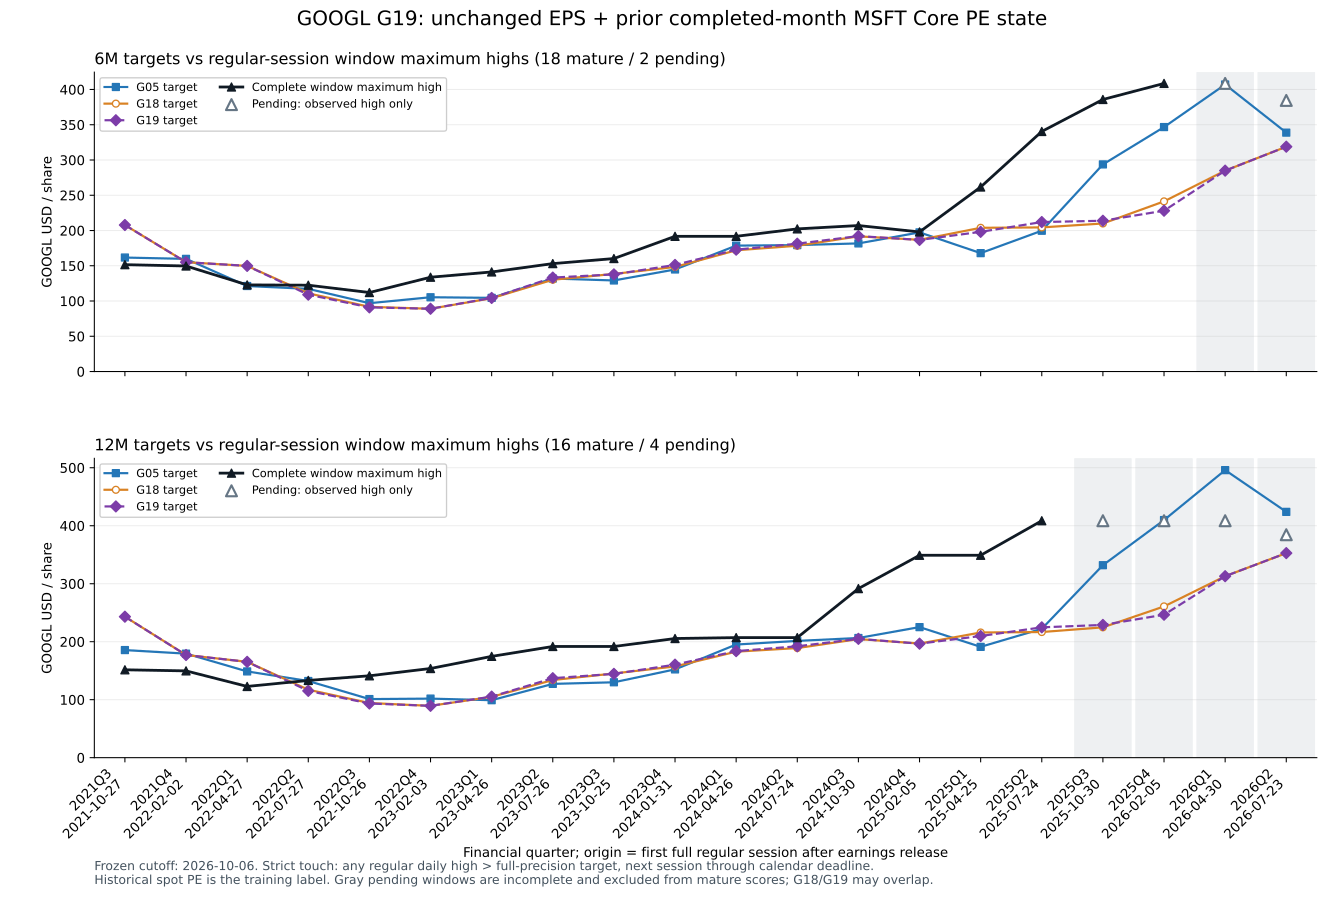
固定2021Q3至2026Q2的20个财报后起点。6M成熟18、待到期2;12M成熟16、待到期4。全部模型共用原日期和价格窗口,采用对照为G05与父候选G18,G16/G17只作诊断。Twenty fixed post-earnings origins span 2021Q3 through 2026Q2: eighteen mature and two pending windows at 6M, sixteen mature and four pending at 12M. All models share the original dates and price windows. Adoption references are G05 and parent candidate G18; G16/G17 are diagnostic only.固定2021Q3至2026Q2的20個財報後起點。6M成熟18、待到期2;12M成熟16、待到期4。全部模型共用原日期和價格窗口,採用對照為G05與父候選G18,G16/G17只作診斷。
每个季度只在财报后首个完整纽约常规交易日收盘形成一次预测。观察从下一交易日开始,到6M或12M日历截止日含当日;任意常规时段日内最高价严格高于未舍入目标即算触达,等于不算,不能借用期限后高点。先比较成熟触达率,再比较全部成熟样本的平均|目标价÷完整期间最高价−1|,未触达样本也计入。One forecast is formed at the first complete New York regular-session close following each quarterly earnings release. Observation begins on the next session and ends on the 6M or 12M calendar deadline inclusive. Any regular-session high strictly above the unrounded target is a hit; equality does not qualify and later highs are excluded. Mature hit rate comes first, then mean |target / complete-window maximum high − 1| across all mature samples, including misses.每個季度只在財報後首個完整紐約常規交易日收盤形成一次預測。觀察從下一交易日開始,到6M或12M日曆截止日含當日;任意常規時段日內最高價嚴格高於未舍入目標即算觸達,等於不算,不能借用期限後高點。先比較成熟觸達率,再比較全部成熟樣本的平均|目標價÷完整期間最高價−1|,未觸達樣本也計入。
| 版本Model版本 | 期限Horizon期限 | 成熟触达Mature hits成熟觸達 | 触达率Hit rate觸達率 | 平均绝对峰值差Mean absolute peak gap平均絕對峯值差 | 平均最高价/目标Mean peak/target平均最高價/目標 | 目标低于起点价Targets below origin price目標低於起點價 | 待到期Pending待到期 |
|---|---|---|---|---|---|---|---|
| G05 | 6M | 16/18 | 88.89% | 15.80% | 119.64% | 0 | 2 |
| G05 | 12M | 13/16 | 81.25% | 26.59% | 132.52% | 3 | 4 |
| G16 · 诊断diagnostic診斷 | 6M | 14/18 | 77.78% | 24.29% | 123.73% | 9 | 2 |
| G16 · 诊断diagnostic診斷 | 12M | 13/16 | 81.25% | 34.25% | 134.21% | 4 | 4 |
| G17 · 诊断diagnostic診斷 | 6M | 16/18 | 88.89% | 30.86% | 141.23% | 15 | 2 |
| G17 · 诊断diagnostic診斷 | 12M | 12/16 | 75.00% | 48.13% | 170.78% | 11 | 4 |
| G18 | 6M | 15/18 | 83.33% | 21.39% | 123.31% | 7 | 2 |
| G18 | 12M | 13/16 | 81.25% | 31.08% | 132.63% | 2 | 4 |
| G19 | 6M | 15/18 | 83.33% | 21.34% | 123.29% | 6 | 2 |
| G19 | 12M | 13/16 | 81.25% | 30.88% | 132.19% | 2 | 4 |
五年6M触达15/18,12M触达13/16,与G18均相同。平均绝对峰值差6M由21.39%降至21.34%,12M由31.08%降至30.88%,改善有限,仍高于G05。当前同行系数为0.00000000,所以当前三期限值与G18完全相同;历史20个季度中有14个起点同行系数为正,回测结果可以微幅改变。Five-year hits are 15/18 at 6M and 13/16 at 12M, unchanged from G18. Mean absolute peak gaps fall from 21.39% to 21.34% at 6M and from 31.08% to 30.88% at 12M. The improvement is small and gaps remain above G05. The current peer slope is 0.00000000, leaving current values identical to G18. It is positive at 14 of the twenty historical quarterly origins, so retrospective scores can change slightly.五年6M觸達15/18,12M觸達13/16,與G18均相同。平均絕對峯值差6M由21.39%降至21.34%,12M由31.08%降至30.88%,改善有限,仍高於G05。當前同行係數為0.00000000,所以當前三期限值與G18完全相同;歷史20個季度中有14個起點同行係數為正,回測結果可以微幅改變。
待到期窗口只展示截至冻结日已观察最高价及触达,不称完整最高价,不进入成熟触达率或完整峰值差。目标低于起点价单列;平均最高价/目标价是诊断比例,不是越大越好,也不是投资收益率。Pending windows show the peak and touch observed through the cutoff only, not a complete-window maximum. They do not enter mature hit rates or complete peak gaps. Targets below the origin price are flagged separately. Mean peak/target is a diagnostic ratio, not a metric to maximize or an investment return.待到期窗口只展示截至凍結日已觀察最高價及觸達,不稱完整最高價,不進入成熟觸達率或完整峯值差。目標低於起點價單列;平均最高價/目標價是診斷比例,不是越大越好,也不是投資收益率。
固定G05上涨目标共同样本Fixed common G05 upside-target cohort固定G05上漲目標共同樣本
| 版本Model版本 | 期限Horizon期限 | 成熟触达Mature hits成熟觸達 | 触达率Hit rate觸達率 | 平均绝对峰值差Mean absolute peak gap平均絕對峯值差 | 平均最高价/目标Mean peak/target平均最高價/目標 | 目标低于起点价Targets below origin price目標低於起點價 | 待到期Pending待到期 |
|---|---|---|---|---|---|---|---|
| G05 | 6M | 16/18 | 88.89% | 15.80% | 119.64% | 0 | 0 |
| G05 | 12M | 10/13 | 76.92% | 24.21% | 126.34% | 0 | 0 |
| G16 · 诊断diagnostic診斷 | 6M | 14/18 | 77.78% | 24.29% | 123.73% | 9 | 0 |
| G16 · 诊断diagnostic診斷 | 12M | 10/13 | 76.92% | 32.74% | 126.19% | 1 | 0 |
| G17 · 诊断diagnostic診斷 | 6M | 16/18 | 88.89% | 30.86% | 141.23% | 15 | 0 |
| G17 · 诊断diagnostic診斷 | 12M | 9/13 | 69.23% | 46.26% | 157.47% | 8 | 0 |
| G18 | 6M | 15/18 | 83.33% | 21.39% | 123.31% | 7 | 0 |
| G18 | 12M | 10/13 | 76.92% | 29.63% | 126.18% | 1 | 0 |
| G19 | 6M | 15/18 | 83.33% | 21.34% | 123.29% | 6 | 0 |
| G19 | 12M | 10/13 | 76.92% | 29.53% | 125.94% | 1 | 0 |
共同集合由原G05成熟目标不低于起点价固定,6M为18点、12M为13点。各模型共享分母,G19自己的较低目标不能改变样本。The common cohort is fixed by mature G05 targets at least as high as the origin price: eighteen at 6M and thirteen at 12M. Models share the denominator; lower G19 targets cannot change membership.共同集合由原G05成熟目標不低於起點價固定,6M為18點、12M為13點。各模型共享分母,G19自己的較低目標不能改變樣本。
20个季度逐次目标价与期间最高价All twenty quarterly targets and respective window highs20個季度逐次目標價與期間最高價
以下保留原20个季度及每次独立形成的6M、12M目标。同行月末在起点之前;同一起点6M与12M使用同一Google PE。两位小数仅供展示,触达用全精度判断。The tables preserve all twenty original quarterly origins and their separately formed 6M and 12M targets. Peer month-end precedes the origin; 6M and 12M share the same Google P/E at each origin. Two decimals are display rounding only; hits use full precision.以下保留原20個季度及每次獨立形成的6M、12M目標。同行月末在起點之前;同一起點6M與12M使用同一Google PE。兩位小數僅供展示,觸達用全精度判斷。
6M
| 季度Quarter季度 | 财报后起点Post-earnings origin財報後起點 | G19 PEG19 P/EG19 PE | 同行月末 / PEPeer month-end / P/E同行月末 / PE | G05 6M | G16 6M | G17 6M | G18 6M | G19 6M | 完整最高 / 待期观察高点Complete high / pending observed peak完整最高 / 待期觀察高點 | G19状态与触达G19 status and touchG19狀態與觸達 | 绝对峰值差Absolute peak gap絕對峯值差 | 最高价/目标Peak/target最高價/目標 | 目标低于起点Target below origin目標低於起點 | 训练月 / 财务季Training months / vintages訓練月 / 財務季 |
|---|---|---|---|---|---|---|---|---|---|---|---|---|---|---|
| 2021Q3 | 2021-10-27 | 30.1237× | 2021-09-30 29.6285×; bm=0.000000 | $161.63 | $207.78 | $225.23 | $207.78 | $207.78 | $151.55 2022-02-02 | 成熟 · 未触达Mature · miss成熟 · 未觸達 | 37.10% | 72.94% | 否No否 | 8 / 3 历史中位数冷启动Historical-median cold start歷史中位數冷啓動 |
| 2021Q4 | 2022-02-02 | 22.2857× | 2022-01-31 29.3761×; bm=0.000000 | $159.76 | $176.29 | $142.70 | $155.07 | $155.07 | $149.68 2022-02-03 | 成熟 · 未触达Mature · miss成熟 · 未觸達 | 3.60% | 96.52% | 否No否 | 12 / 4 |
| 2022Q1 | 2022-04-27 | 21.4602× | 2022-03-31 28.5788×; bm=0.000000 | $121.24 | $166.44 | $138.52 | $149.80 | $149.80 | $122.85 2022-05-04 | 成熟 · 未触达Mature · miss成熟 · 未觸達 | 21.93% | 82.01% | 否No否 | 14 / 5 |
| 2022Q2 | 2022-07-27 | 18.2979× | 2022-06-30 23.2289×; bm=0.009319 | $117.23 | $125.86 | $108.36 | $110.91 | $108.99 | $122.43 2022-08-16 | 成熟 · 触达Mature · hit成熟 · 觸達 | 10.98% | 112.33% | 是Yes是 | 17 / 6 |
| 2022Q3 | 2022-10-26 | 17.1164× | 2022-09-30 22.0527×; bm=0.005231 | $96.90 | $97.26 | $85.21 | $91.72 | $90.98 | $112.02 2023-03-29 | 成熟 · 触达Mature · hit成熟 · 觸達 | 18.78% | 123.13% | 是Yes是 | 20 / 7 |
| 2022Q4 | 2023-02-03 | 18.2886× | 2023-01-31 25.9203×; bm=0.000000 | $105.35 | $93.29 | $80.74 | $89.00 | $89.00 | $133.74 2023-07-28 | 成熟 · 触达Mature · hit成熟 · 觸達 | 33.45% | 150.27% | 是Yes是 | 24 / 8 |
| 2023Q1 | 2023-04-26 | 20.3806× | 2023-03-31 30.1123×; bm=0.002659 | $104.47 | $100.53 | $86.18 | $103.96 | $104.33 | $141.22 2023-10-12 | 成熟 · 触达Mature · hit成熟 · 觸達 | 26.12% | 135.35% | 否No否 | 26 / 9 |
| 2023Q2 | 2023-07-26 | 24.0588× | 2023-06-30 32.4710×; bm=0.017586 | $131.89 | $109.29 | $91.26 | $130.15 | $133.22 | $153.05 2024-01-25 | 成熟 · 触达Mature · hit成熟 · 觸達 | 12.95% | 114.88% | 否No否 | 29 / 10 |
| 2023Q3 | 2023-10-25 | 22.7674× | 2023-09-29 28.1523×; bm=0.018381 | $129.15 | $122.24 | $106.21 | $138.44 | $137.78 | $160.22 2024-04-12 | 成熟 · 触达Mature · hit成熟 · 觸達 | 14.01% | 116.29% | 否No否 | 32 / 11 |
| 2023Q4 | 2024-01-31 | 22.4460× | 2023-12-29 31.3524×; bm=0.019213 | $144.73 | $142.16 | $122.30 | $148.31 | $151.16 | $191.75 2024-07-10 | 成熟 · 触达Mature · hit成熟 · 觸達 | 21.17% | 126.85% | 否No否 | 35 / 12 |
| 2024Q1 | 2024-04-26 | 23.1336× | 2024-03-28 30.4224×; bm=0.018075 | $178.57 | $156.35 | $135.66 | $171.94 | $172.83 | $191.75 2024-07-10 | 成熟 · 触达Mature · hit成熟 · 觸達 | 9.87% | 110.95% | 否No否 | 38 / 13 |
| 2024Q2 | 2024-07-24 | 23.0227× | 2024-06-28 31.9142×; bm=0.017414 | $179.29 | $170.70 | $145.57 | $178.43 | $181.29 | $202.29 2025-01-21 | 成熟 · 触达Mature · hit成熟 · 觸達 | 10.38% | 111.58% | 否No否 | 41 / 14 |
| 2024Q3 | 2024-10-30 | 22.4368× | 2024-09-30 29.5186×; bm=0.017028 | $181.71 | $185.86 | $162.09 | $191.71 | $192.12 | $207.05 2025-02-04 | 成熟 · 触达Mature · hit成熟 · 觸達 | 7.21% | 107.77% | 否No否 | 44 / 15 |
| 2024Q4 | 2025-02-05 | 21.3430× | 2025-01-31 28.0873×; bm=0.016730 | $197.33 | $189.69 | $167.93 | $186.81 | $186.62 | $197.95 2025-07-24 | 成熟 · 触达Mature · hit成熟 · 觸達 | 5.72% | 106.07% | 是Yes是 | 48 / 16 |
| 2025Q1 | 2025-04-25 | 21.0786× | 2025-03-31 25.0918×; bm=0.021537 | $167.92 | $200.58 | $177.65 | $203.83 | $198.11 | $261.68 2025-10-24 | 成熟 · 触达Mature · hit成熟 · 觸達 | 24.29% | 132.09% | 否No否 | 50 / 17 |
| 2025Q2 | 2025-07-24 | 21.2289× | 2025-06-30 31.2234×; bm=0.031559 | $199.71 | $208.82 | $188.31 | $204.39 | $212.01 | $340.49 2026-01-13 | 成熟 · 触达Mature · hit成熟 · 觸達 | 37.73% | 160.60% | 否No否 | 53 / 18 |
| 2025Q3 | 2025-10-30 | 20.6961× | 2025-09-30 29.4419×; bm=0.031743 | $293.73 | $219.22 | $200.80 | $209.96 | $213.83 | $385.84 2026-04-30 | 成熟 · 触达Mature · hit成熟 · 觸達 | 44.58% | 180.44% | 是Yes是 | 56 / 19 |
| 2025Q4 | 2026-02-05 | 20.6828× | 2026-01-30 23.0398×; bm=0.027957 | $346.71 | $245.07 | $220.01 | $241.31 | $228.08 | $408.61 2026-05-18 | 成熟 · 触达Mature · hit成熟 · 觸達 | 44.18% | 179.15% | 是Yes是 | 60 / 20 |
| 2026Q1 | 2026-04-30 | 23.2366× | 2026-03-31 19.4952×; bm=0.000000 | $407.08 | $279.57 | $250.62 | $284.92 | $284.92 | $408.61 · 仅观察observed only僅觀察 2026-05-18 | 待到期 · 已观察触达Pending · touch observed待到期 · 已觀察觸達 | — | — | 是Yes是 | 60 / 20 |
| 2026Q2 | 2026-07-23 | 23.7548× | 2026-06-30 18.1356×; bm=0.000000 | $338.82 | $318.60 | $280.72 | $318.88 | $318.88 | $384.48 · 仅观察observed only僅觀察 2026-08-05 | 待到期 · 已观察触达Pending · touch observed待到期 · 已觀察觸達 | — | — | 否No否 | 60 / 20 |
12M
| 季度Quarter季度 | 财报后起点Post-earnings origin財報後起點 | G19 PEG19 P/EG19 PE | 同行月末 / PEPeer month-end / P/E同行月末 / PE | G05 12M | G16 12M | G17 12M | G18 12M | G19 12M | 完整最高 / 待期观察高点Complete high / pending observed peak完整最高 / 待期觀察高點 | G19状态与触达G19 status and touchG19狀態與觸達 | 绝对峰值差Absolute peak gap絕對峯值差 | 最高价/目标Peak/target最高價/目標 | 目标低于起点Target below origin目標低於起點 | 训练月 / 财务季Training months / vintages訓練月 / 財務季 |
|---|---|---|---|---|---|---|---|---|---|---|---|---|---|---|
| 2021Q3 | 2021-10-27 | 30.1237× | 2021-09-30 29.6285×; bm=0.000000 | $185.53 | $243.12 | $243.12 | $243.12 | $243.12 | $151.55 2022-02-02 | 成熟 · 未触达Mature · miss成熟 · 未觸達 | 60.43% | 62.33% | 否No否 | 8 / 3 历史中位数冷启动Historical-median cold start歷史中位數冷啓動 |
| 2021Q4 | 2022-02-02 | 22.2857× | 2022-01-31 29.3761×; bm=0.000000 | $179.41 | $201.30 | $201.30 | $177.07 | $177.07 | $149.68 2022-02-03 | 成熟 · 未触达Mature · miss成熟 · 未觸達 | 18.30% | 84.53% | 否No否 | 12 / 4 |
| 2022Q1 | 2022-04-27 | 21.4602× | 2022-03-31 28.5788×; bm=0.000000 | $148.73 | $183.62 | $196.52 | $165.27 | $165.27 | $122.85 2022-05-04 | 成熟 · 未触达Mature · miss成熟 · 未觸達 | 34.52% | 74.34% | 否No否 | 14 / 5 |
| 2022Q2 | 2022-07-27 | 18.2979× | 2022-06-30 23.2289×; bm=0.009319 | $132.20 | $133.04 | $151.39 | $117.24 | $115.21 | $133.24 2023-07-27 | 成熟 · 触达Mature · hit成熟 · 觸達 | 13.53% | 115.65% | 否No否 | 17 / 6 |
| 2022Q3 | 2022-10-26 | 17.1164× | 2022-09-30 22.0527×; bm=0.005231 | $101.04 | $99.88 | $70.71 | $94.20 | $93.43 | $141.22 2023-10-12 | 成熟 · 触达Mature · hit成熟 · 觸達 | 33.84% | 151.14% | 是Yes是 | 20 / 7 |
| 2022Q4 | 2023-02-03 | 18.2886× | 2023-01-31 25.9203×; bm=0.000000 | $101.85 | $93.71 | $66.06 | $89.40 | $89.40 | $153.78 2024-01-29 | 成熟 · 触达Mature · hit成熟 · 觸達 | 41.87% | 172.01% | 是Yes是 | 24 / 8 |
| 2023Q1 | 2023-04-26 | 20.3806× | 2023-03-31 30.1123×; bm=0.002659 | $99.11 | $101.47 | $76.88 | $104.93 | $105.31 | $174.71 2024-04-26 | 成熟 · 触达Mature · hit成熟 · 觸達 | 39.73% | 165.91% | 否No否 | 26 / 9 |
| 2023Q2 | 2023-07-26 | 24.0588× | 2023-06-30 32.4710×; bm=0.017586 | $127.24 | $112.43 | $85.09 | $133.89 | $137.05 | $191.75 2024-07-10 | 成熟 · 触达Mature · hit成熟 · 觸達 | 28.53% | 139.91% | 否No否 | 29 / 10 |
| 2023Q3 | 2023-10-25 | 22.7674× | 2023-09-29 28.1523×; bm=0.018381 | $130.01 | $128.23 | $94.63 | $145.22 | $144.53 | $191.75 2024-07-10 | 成熟 · 触达Mature · hit成熟 · 觸達 | 24.63% | 132.67% | 否No否 | 32 / 11 |
| 2023Q4 | 2024-01-31 | 22.4460× | 2023-12-29 31.3524×; bm=0.019213 | $152.24 | $150.87 | $111.87 | $157.40 | $160.43 | $205.48 2025-01-31 | 成熟 · 触达Mature · hit成熟 · 觸達 | 21.93% | 128.08% | 否No否 | 35 / 12 |
| 2024Q1 | 2024-04-26 | 23.1336× | 2024-03-28 30.4224×; bm=0.018075 | $195.11 | $166.23 | $123.51 | $182.80 | $183.75 | $207.05 2025-02-04 | 成熟 · 触达Mature · hit成熟 · 觸達 | 11.25% | 112.68% | 否No否 | 38 / 13 |
| 2024Q2 | 2024-07-24 | 23.0227× | 2024-06-28 31.9142×; bm=0.017414 | $201.36 | $180.83 | $134.60 | $189.02 | $192.06 | $207.05 2025-02-04 | 成熟 · 触达Mature · hit成熟 · 觸達 | 7.24% | 107.80% | 否No否 | 41 / 14 |
| 2024Q3 | 2024-10-30 | 22.4368× | 2024-09-30 29.5186×; bm=0.017028 | $206.40 | $198.26 | $151.45 | $204.49 | $204.93 | $291.59 2025-10-30 | 成熟 · 触达Mature · hit成熟 · 觸達 | 29.72% | 142.29% | 否No否 | 44 / 15 |
| 2024Q4 | 2025-02-05 | 21.3430× | 2025-01-31 28.0873×; bm=0.016730 | $225.16 | $199.83 | $157.38 | $196.81 | $196.61 | $349.00 2026-02-03 | 成熟 · 触达Mature · hit成熟 · 觸達 | 43.67% | 177.51% | 否No否 | 48 / 16 |
| 2025Q1 | 2025-04-25 | 21.0786× | 2025-03-31 25.0918×; bm=0.021537 | $191.12 | $212.41 | $168.41 | $215.86 | $209.80 | $349.00 2026-02-03 | 成熟 · 触达Mature · hit成熟 · 觸達 | 39.89% | 166.35% | 否No否 | 50 / 17 |
| 2025Q2 | 2025-07-24 | 21.2289× | 2025-06-30 31.2234×; bm=0.031559 | $222.23 | $221.37 | $176.97 | $216.68 | $224.75 | $408.61 2026-05-18 | 成熟 · 触达Mature · hit成熟 · 觸達 | 45.00% | 181.80% | 否No否 | 53 / 18 |
| 2025Q3 | 2025-10-30 | 20.6961× | 2025-09-30 29.4419×; bm=0.031743 | $331.96 | $234.67 | $188.42 | $224.77 | $228.91 | $408.61 · 仅观察observed only僅觀察 2026-05-18 | 待到期 · 已观察触达Pending · touch observed待到期 · 已觀察觸達 | — | — | 是Yes是 | 56 / 19 |
| 2025Q4 | 2026-02-05 | 20.6828× | 2026-01-30 23.0398×; bm=0.027957 | $409.73 | $264.89 | $207.82 | $260.82 | $246.52 | $408.61 · 仅观察observed only僅觀察 2026-05-18 | 待到期 · 已观察触达Pending · touch observed待到期 · 已觀察觸達 | — | — | 是Yes是 | 60 / 20 |
| 2026Q1 | 2026-04-30 | 23.2366× | 2026-03-31 19.4952×; bm=0.000000 | $495.88 | $307.07 | $241.82 | $312.95 | $312.95 | $408.61 · 仅观察observed only僅觀察 2026-05-18 | 待到期 · 已观察触达Pending · touch observed待到期 · 已觀察觸達 | — | — | 是Yes是 | 60 / 20 |
| 2026Q2 | 2026-07-23 | 23.7548× | 2026-06-30 18.1356×; bm=0.000000 | $423.88 | $352.44 | $288.01 | $352.75 | $352.75 | $384.48 · 仅观察observed only僅觀察 2026-08-05 | 待到期 · 已观察触达Pending · touch observed待到期 · 已觀察觸達 | — | — | 否No否 | 60 / 20 |
待到期窗口只展示截至冻结日已观察最高价及触达,不称完整最高价,不进入成熟触达率或完整峰值差。目标低于起点价单列;平均最高价/目标价是诊断比例,不是越大越好,也不是投资收益率。Pending windows show the peak and touch observed through the cutoff only, not a complete-window maximum. They do not enter mature hit rates or complete peak gaps. Targets below the origin price are flagged separately. Mean peak/target is a diagnostic ratio, not a metric to maximize or an investment return.待到期窗口只展示截至凍結日已觀察最高價及觸達,不稱完整最高價,不進入成熟觸達率或完整峯值差。目標低於起點價單列;平均最高價/目標價是診斷比例,不是越大越好,也不是投資收益率。
近三年辅助回测Three-year auxiliary test近三年輔助回測
近三年12个季度起点,6M成熟10次、12M成熟8次。该小样本上的100%历史触达不是未来概率,不能取代五年正式筛选。The three-year panel has twelve quarterly origins, with ten mature 6M and eight mature 12M windows. A 100% historical hit rate on this small sample is not a future probability and cannot replace the formal five-year screen.近三年12個季度起點,6M成熟10次、12M成熟8次。該小樣本上的100%歷史觸達不是未來概率,不能取代五年正式篩選。
| 版本Model版本 | 期限Horizon期限 | 成熟触达Mature hits成熟觸達 | 触达率Hit rate觸達率 | 平均绝对峰值差Mean absolute peak gap平均絕對峯值差 | 平均最高价/目标Mean peak/target平均最高價/目標 | 目标低于起点价Targets below origin price目標低於起點價 | 待到期Pending待到期 |
|---|---|---|---|---|---|---|---|
| G05 | 6M | 10/10 | 100.00% | 19.09% | 126.66% | 0 | 2 |
| G05 | 12M | 8/8 | 100.00% | 27.77% | 144.27% | 0 | 4 |
| G16 · 诊断diagnostic診斷 | 6M | 10/10 | 100.00% | 24.33% | 135.91% | 6 | 2 |
| G16 · 诊断diagnostic診斷 | 12M | 8/8 | 100.00% | 31.47% | 149.42% | 1 | 4 |
| G17 · 诊断diagnostic診斷 | 6M | 10/10 | 100.00% | 33.50% | 153.96% | 9 | 2 |
| G17 · 诊断diagnostic診斷 | 12M | 8/8 | 100.00% | 47.87% | 195.02% | 7 | 4 |
| G18 | 6M | 10/10 | 100.00% | 22.00% | 133.19% | 4 | 2 |
| G18 | 12M | 8/8 | 100.00% | 28.34% | 144.45% | 0 | 4 |
| G19 | 6M | 10/10 | 100.00% | 21.91% | 133.18% | 3 | 2 |
| G19 | 12M | 8/8 | 100.00% | 27.91% | 143.65% | 0 | 4 |
同日分析师12M比较:2/12覆盖Same-day analyst 12M comparison: two of twelve observations同日分析師12M比較:2/12覆蓋
三年12个季度起点仅2条保存的精确同日StockAnalysis平均12M目标,10条缺失。G19两条平均目标差为1.23%,但不能据此宣称完整三年分析师验证或未来价格更准确。分析师只作辅助比较,不进入拟合、选参或采用;不取邻日,不插值,商业原始记录留内部。Only two of twelve three-year quarterly origins have saved exact same-day StockAnalysis mean 12M targets; ten are missing. G19’s mean target gap on those two observations is 1.23%, which cannot establish a complete three-year analyst validation or better future-price accuracy. Analyst targets are diagnostic only, never fitting, tuning or adoption inputs. Nearby dates and interpolation are excluded, and licensed raw records remain internal.三年12個季度起點僅2條保存的精確同日StockAnalysis平均12M目標,10條缺失。G19兩條平均目標差為1.23%,但不能據此宣稱完整三年分析師驗證或未來價格更準確。分析師只作輔助比較,不進入擬合、選參或採用;不取鄰日,不插值,商業原始記錄留內部。
| 聚合诊断Aggregate diagnostic聚合診斷 | G05 | G16 | G17 | G18 | G19 |
|---|---|---|---|---|---|
| 精确同日 / 应有季度Exact same-day / required quarters精確同日 / 應有季度 | 2 / 12 | 2 / 12 | 2 / 12 | 2 / 12 | 2 / 12 |
| 平均绝对分析师目标差Mean absolute analyst-target gap平均絕對分析師目標差 | 3.40% | 5.78% | 29.06% | 2.26% | 1.23% |
采用结论与验证状态Adoption decision and validation status採用結論與驗證狀態
G19的18项冻结条件中,11项通过、7项失败,未替换主预测。个股页继续分别保留G16的0M条件公平估计$318.51与G05的6M $368.45、12M $464.42;三个报价标注各自版本,不组合成新模型。11 of 18 frozen conditions pass and 7 fail. G19 does not replace the retained forecasts. The equity page retains separate G16 conditional 0M value $318.51 and G05 6M / 12M forecasts $368.45 / $464.42, each labeled with its own version rather than combined into a new model.G19的18項凍結條件中,11項通過、7項失敗,未替換主預測。個股頁繼續分別保留G16的0M條件公平估計$318.51與G05的6M $368.45、12M $464.42;三個報價標註各自版本,不組合成新模型。
独立工程核验通过;候选仍未通过替换条件。Independent engineering checks passed; the candidate still fails replacement conditions.獨立工程核驗通過;候選仍未通過替換條件。
全部18项条件事先要求:相对G05和G18,两期限在完整成熟样本与固定共同上涨目标集合上触达不差、平均峰值差不大,并相对每个参考至少一项完整样本严格改善。G19对G18的9项通过,对G05仍有7项失败。保留整个失败版本,不将其某个期限或同行系数拼入主模型。All eighteen conditions were fixed in advance: against both G05 and G18, require nonworse hit rates and no larger mean peak gaps at both horizons in the full mature panel and fixed common upside-target cohort, plus at least one strict full-panel improvement against each reference. All nine G18 conditions pass, but seven G05 conditions still fail. Preserve the complete failed version without splicing a horizon or peer coefficient into retained forecasts.全部18項條件事先要求:相對G05和G18,兩期限在完整成熟樣本與固定共同上漲目標集合上觸達不差、平均峯值差不大,並相對每個參考至少一項完整樣本嚴格改善。G19對G18的9項通過,對G05仍有7項失敗。保留整個失敗版本,不將其某個期限或同行係數拼入主模型。
查看全部18项冻结条件View all eighteen frozen conditions查看全部18項凍結條件
| 条件Condition條件 | 结果Result結果 |
|---|---|
| 6M 全样本:触达率不劣于G056M full panel: hit rate nonworse than G056M 全樣本:觸達率不劣於G05 | 失败Fail失敗 |
| 6M 全样本:峰值差不劣于G056M full panel: peak gap nonworse than G056M 全樣本:峯值差不劣於G05 | 失败Fail失敗 |
| 6M 固定G05上涨目标共同样本:触达率不劣于G056M fixed common G05 upside cohort: hit rate nonworse than G056M 固定G05上漲目標共同樣本:觸達率不劣於G05 | 失败Fail失敗 |
| 6M 固定G05上涨目标共同样本:峰值差不劣于G056M fixed common G05 upside cohort: peak gap nonworse than G056M 固定G05上漲目標共同樣本:峯值差不劣於G05 | 失败Fail失敗 |
| 12M 全样本:触达率不劣于G0512M full panel: hit rate nonworse than G0512M 全樣本:觸達率不劣於G05 | 通过Pass通過 |
| 12M 全样本:峰值差不劣于G0512M full panel: peak gap nonworse than G0512M 全樣本:峯值差不劣於G05 | 失败Fail失敗 |
| 12M 固定G05上涨目标共同样本:触达率不劣于G0512M fixed common G05 upside cohort: hit rate nonworse than G0512M 固定G05上漲目標共同樣本:觸達率不劣於G05 | 通过Pass通過 |
| 12M 固定G05上涨目标共同样本:峰值差不劣于G0512M fixed common G05 upside cohort: peak gap nonworse than G0512M 固定G05上漲目標共同樣本:峯值差不劣於G05 | 失败Fail失敗 |
| 相对G05至少一项全样本严格改善At least one strict full-panel improvement versus G05相對G05至少一項全樣本嚴格改善 | 失败Fail失敗 |
| 6M 全样本:触达率不劣于G186M full panel: hit rate nonworse than G186M 全樣本:觸達率不劣於G18 | 通过Pass通過 |
| 6M 全样本:峰值差不劣于G186M full panel: peak gap nonworse than G186M 全樣本:峯值差不劣於G18 | 通过Pass通過 |
| 6M 固定G05上涨目标共同样本:触达率不劣于G186M fixed common G05 upside cohort: hit rate nonworse than G186M 固定G05上漲目標共同樣本:觸達率不劣於G18 | 通过Pass通過 |
| 6M 固定G05上涨目标共同样本:峰值差不劣于G186M fixed common G05 upside cohort: peak gap nonworse than G186M 固定G05上漲目標共同樣本:峯值差不劣於G18 | 通过Pass通過 |
| 12M 全样本:触达率不劣于G1812M full panel: hit rate nonworse than G1812M 全樣本:觸達率不劣於G18 | 通过Pass通過 |
| 12M 全样本:峰值差不劣于G1812M full panel: peak gap nonworse than G1812M 全樣本:峯值差不劣於G18 | 通过Pass通過 |
| 12M 固定G05上涨目标共同样本:触达率不劣于G1812M fixed common G05 upside cohort: hit rate nonworse than G1812M 固定G05上漲目標共同樣本:觸達率不劣於G18 | 通过Pass通過 |
| 12M 固定G05上涨目标共同样本:峰值差不劣于G1812M fixed common G05 upside cohort: peak gap nonworse than G1812M 固定G05上漲目標共同樣本:峯值差不劣於G18 | 通过Pass通過 |
| 相对G18至少一项全样本严格改善At least one strict full-panel improvement versus G18相對G18至少一項全樣本嚴格改善 | 通过Pass通過 |
工程审计通过仅说明算术、来源一致性和时点边界经核验,不等于预测准确率、历史PIT、独立前瞻OOS或正式Champion。当前同行系数为零不表示跳过计算,是预声明约束与收缩下的结果。Engineering passage verifies arithmetic, source consistency and timing boundaries. It does not establish predictive accuracy, historical PIT, independent prospective OOS or formal Champion status. A zero current peer slope is a result of the predeclared constraints and shrinkage, not an omitted calculation.工程審計通過僅説明算術、來源一致性和時點邊界經核驗,不等於預測準確率、歷史PIT、獨立前瞻OOS或正式Champion。當前同行係數為零不表示跳過計算,是預聲明約束與收縮下的結果。
研究意义与边界Research meaning and limitations研究意義與邊界
本轮把“同业倍数环境”做成可检验的历史状态,仍未给Google当前估值增加可支持的同行项。MSFT自身产品、会计或业务重估也可能进入该状态,不能称单一同行已经识别市场共同因子。过去五年已被多代模型反复研究,月末训练和季度价格窗口重叠,不是独立试验。This study makes the peer valuation environment a testable historical state, but does not support an additional peer term in Google’s current valuation. MSFT-specific product, accounting and business rerating can enter the state; one peer cannot identify a proven common-market factor. The same five years have been repeatedly researched across versions, and monthly training and quarterly price windows overlap rather than form independent trials.本輪把“同業倍數環境”做成可檢驗的歷史狀態,仍未給Google當前估值增加可支持的同行項。MSFT自身產品、會計或業務重估也可能進入該狀態,不能稱單一同行已經識別市場共同因子。過去五年已被多代模型反覆研究,月末訓練和季度價格窗口重疊,不是獨立試驗。
Google完整版本与方法Complete Google versions and methodsGoogle完整版本與方法 · G18财报兑现差基础G18 profit-realization foundationG18財報兑現差基礎 · 当前保留个股研究参考Current retained equity research references當前保留個股研究參考